Spectrophotometers are widely used in ink printing plants, paper mills, traffic sign industry, textile and garment printing and dyeing industries, as well as in scientific research institutions, quality inspection institutions, and laboratories.
So, what density indicators can be measured by a spectrodensitometer? How to measure them? We take the Trinity YD series spectrodensitometer as an example and make a detailed summary.
Density measurement
The density measurement function is the measurement of ink density. For printing colors such as cyan, yellow, magenta or black, it is necessary to configure the required density state (A, E, I, T).
For four-color inks, the density values are specified in the C, M, Y, and K values.
For spot color inks, the density value will be the spectral density value of a certain wavelength.
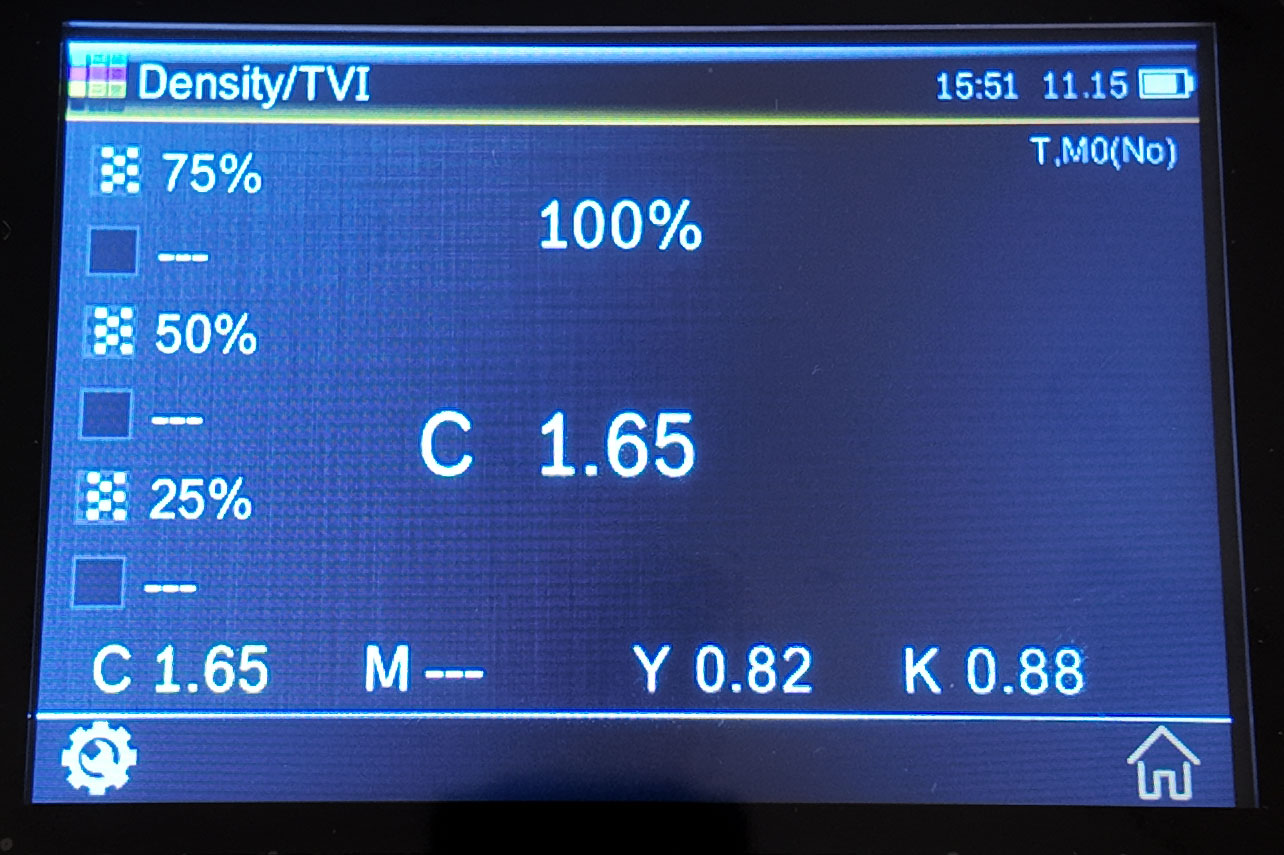
Density measurement method:
1. Set up measurement conditions
2. According to the setting of density reference white, select the touch icon to measure the paper color patch
3. Select the density function
4. Set the density color (options such as automatic or spot color)
5. Measuring samples
6. Measurement completed, check the data
All densities
Displays all (cyan, magenta, yellow and black) density values of the measured sample at the specified density state.
This function can also be configured to further display the density value of the maximum density wavelength of the spectral curve.
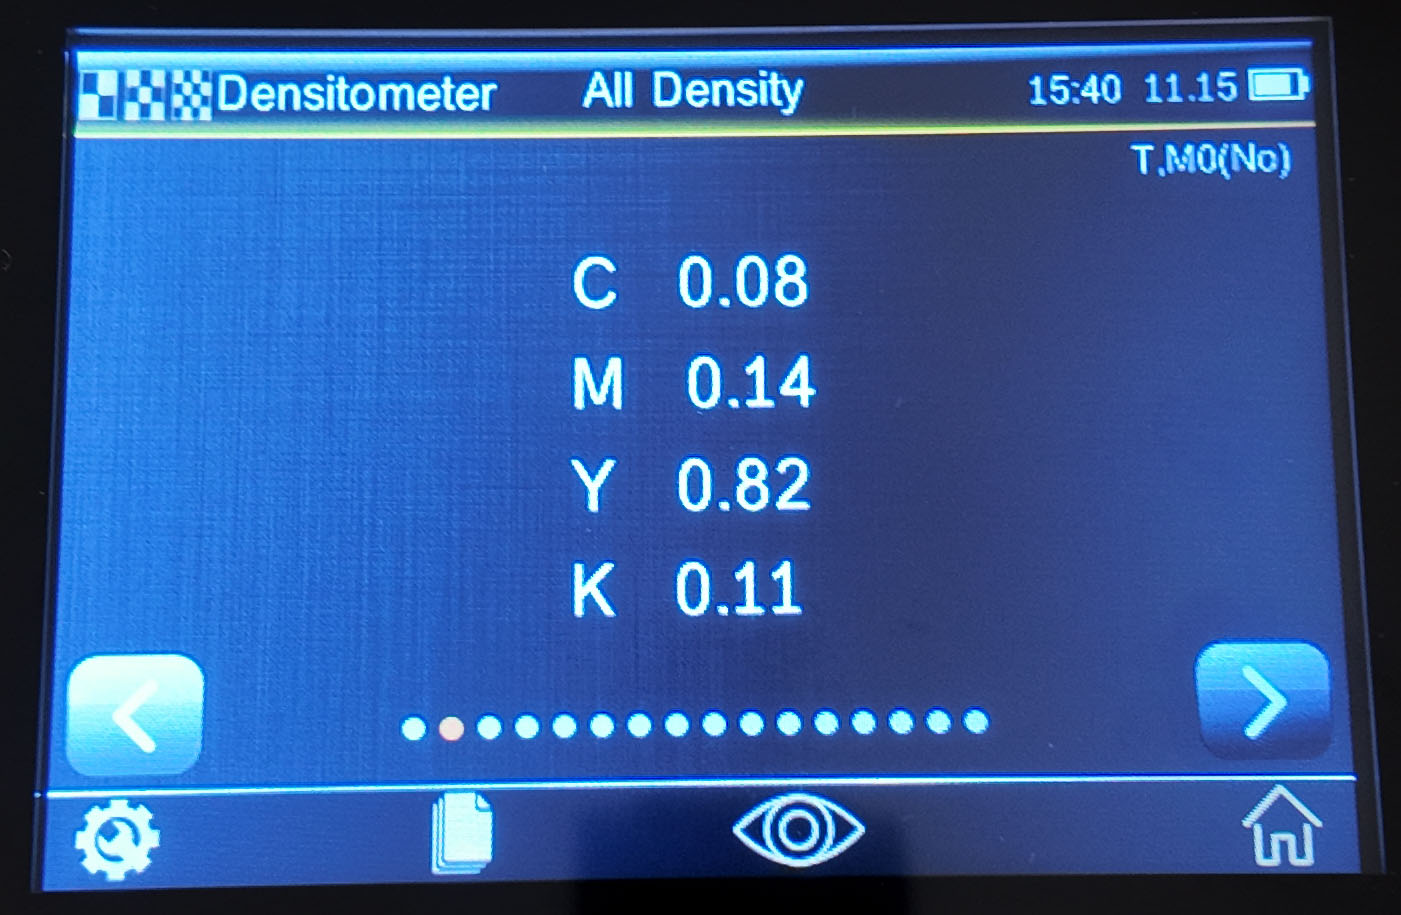
All density measurement methods:
1. Setting the measurement conditions
2. Select the touch icon to measure the paper patch
3. Select the "All Densities" feature
4. Set density color (CMYK or CMYK+spot color etc. options)
5. Measuring samples
6. View data
Tone Value
This function is also called dot area, which refers to the ratio of the sum of the areas of all dots clustered on a unit area to the total area, reflecting the coverage of the ink. The results can be calculated using the Murray-Davis coefficient, the Uhl-Nielsen coefficient, and the SCTV (ISO 20654) method.
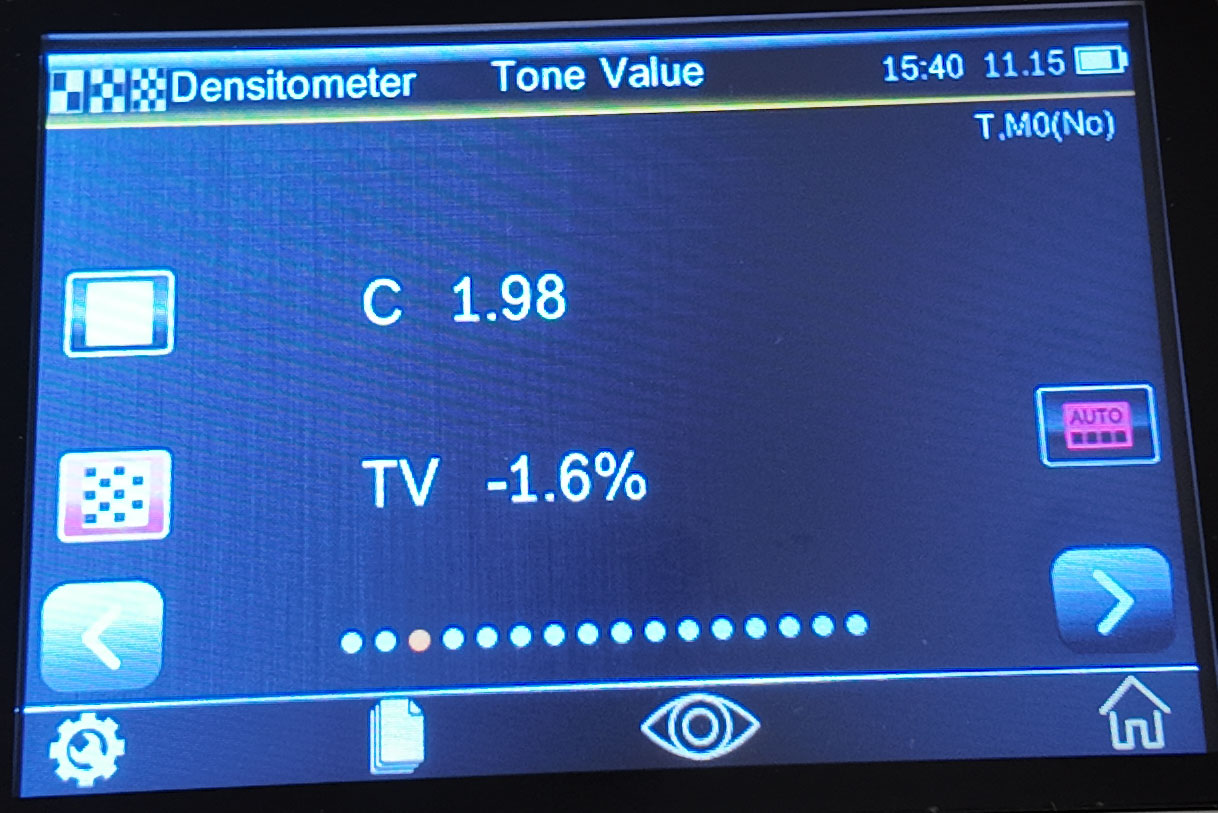
Tone value measurement method:
Displays the hue value of the selected color. Requires a solid and a hue measurement.
1. Select the "Tone Value" function
2. Set the density color
3. Measuring Paper
4. Measuring solid color patches
5. Measuring tint patches
6. View data
Tone value Increase
The tone value function, also known as dot gain, refers to the difference between the actual dot area of the tone color block and the corresponding dot area on the printed sample.
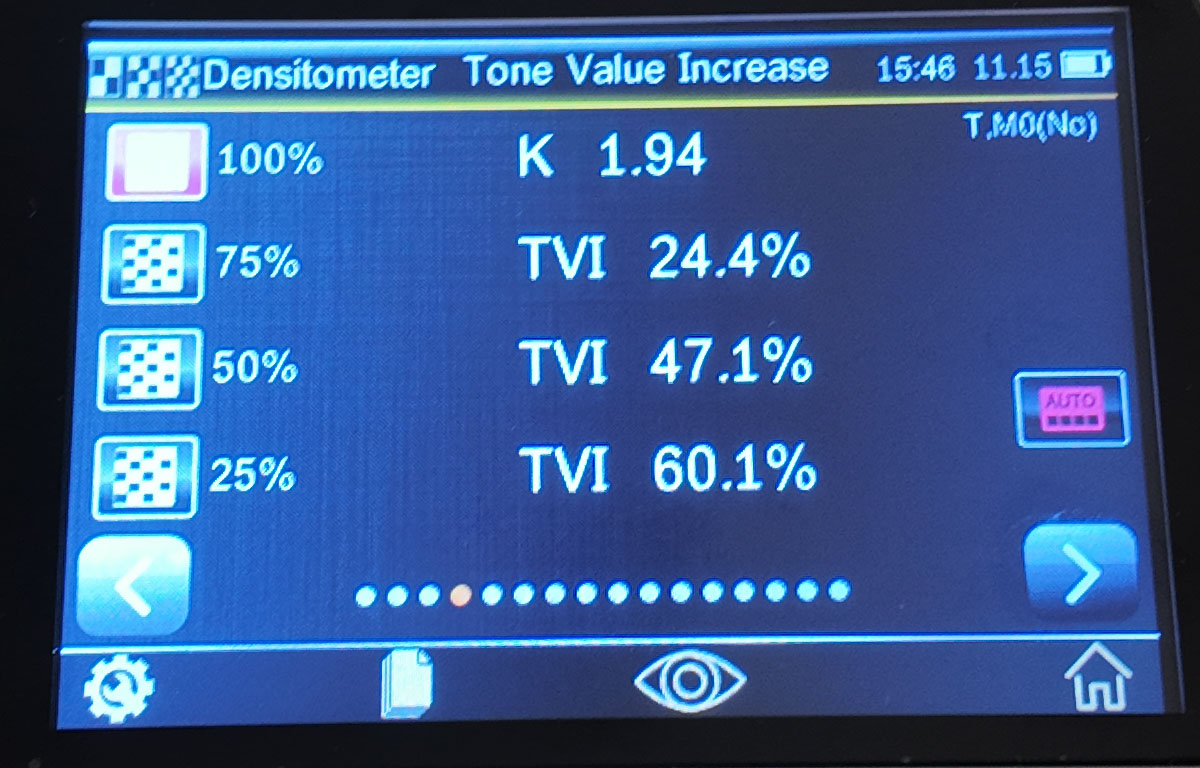
Measurement method for tonal value increase measurement:
1. Select the "Tonal Value Increase" function
2. Select color options as needed
3. Measuring Paper
4. Measuring solid color patches
5. Measuring tint patches
6. Check the dot gain value
Overprint
The overprint function is a physical quantity that measures the degree of ink overprinting. The higher the value, the better the overprinting effect. This value describes the ratio of the ability of the ink printed later to adhere to the ink printed previously to the ink printed on the blank printed material .
There are three ways to calculate the overprint value : Preucil (default), Brunner, and Ritz , which can be adjusted through the settings.
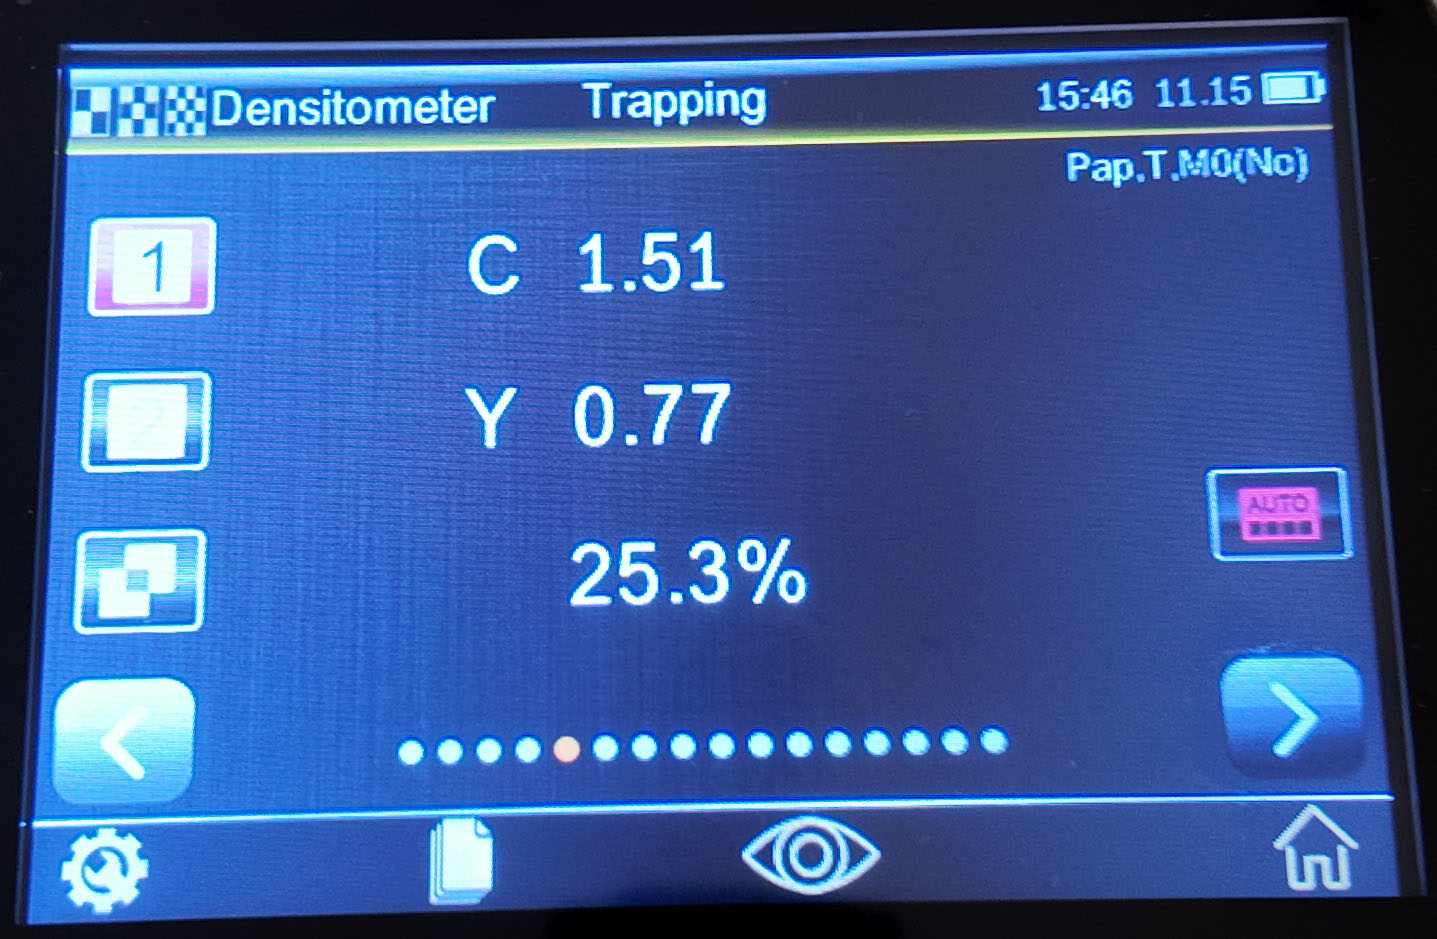
Overprint measurement method:
1. Select the "Overprint" function
2. Measure the paper (after measuring the paper, there is no need to measure again until a new substrate is presented)
3. Measuring the first printed ink patch
4. Measuring the second ink patch
5. Measuring Overprint Patches
6. View data
Printing properties
The Print Characterization feature plots a series of tonal value measurements against a stepped scale target . Starting with a solid ink measurement, the graph then automatically guides the user through each defined step. The graph ranges from 0% to 100%.
1. Select printing feature function
2. Select color options as needed (set density color)
3. Measure paper
4. Measure 100% solid color blocks
5. The lowest color block in the measurement order (i.e. 10%)
6. Continue to measure the color blocks of other levels in increasing order until completion
7. Tap the arrows left or right to view data and browse all steps
Note: To manually return to view the previous measurement result or re-measure, tap the arrow icons on both sides of the icon.
Printing contrast
This function is used to control the index of dark tone in the image, and can determine the standard ink supply for proofing and printing. This value is the ratio of the difference between the solid density of the image and the integrated density of a certain point in the image that is darkened to the solid density.
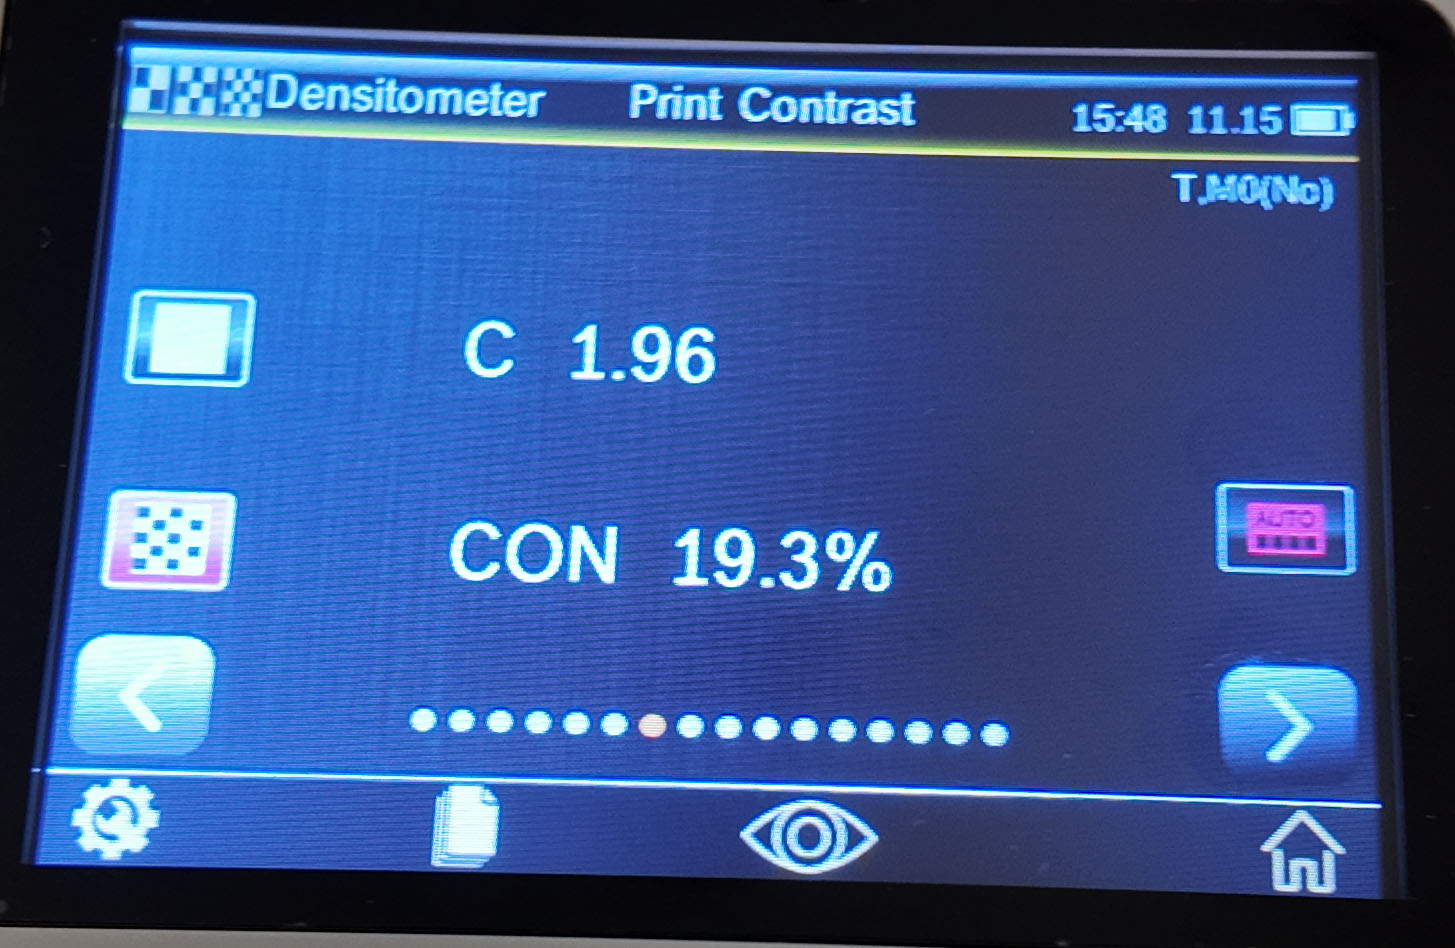
Printing contrast measurement method:
1. Select the printing contrast function
2. Select the color option (set density color)
3. Measure paper as needed
4. Measure solid color patches
5. Measure the color blocks corresponding to the measured field
6. View data
7. Continue with other hue patches corresponding to the measured solid, or touch the solid patch on the left side of the screen and measure another solid patch.
Hue Error and Grayscale
Hue error is caused by the impure color of the ink, which makes the selective absorption of the spectrum poor and produces unnecessary density. Grayscale is the non-color component in the ink that makes it look less saturated. Hue error and grayscale are used to check the color consistency of the entire printing job.
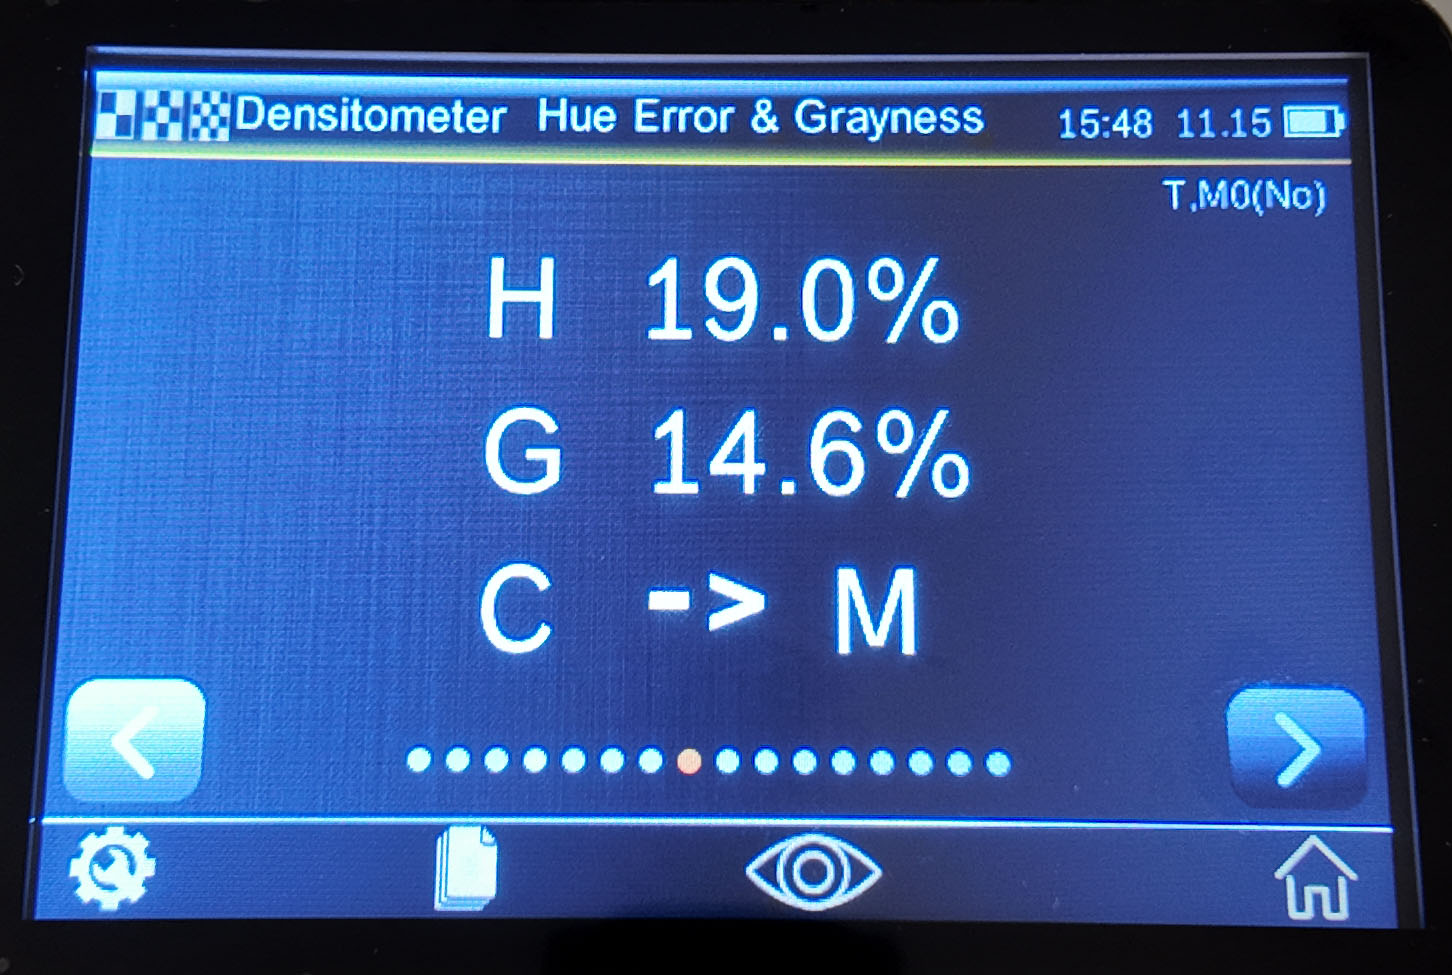
Hue error and grayscale value are displayed together with the direction of color deviation.
Hue error and grayscale measurement methods:
1. Select the hue error and grayscale function
2. Measure paper as needed
3. Measure solid color patches
4. View data


 0086 18165740359
 Skype Online